

Configure and customize Kubernetes Monitoring easier with Alloy Operator
What if you were to tell Kubernetes Monitoring what you wanted, and the system configured collectors based on your choices? We wondered that as well—wondered enough to create Alloy Operator and its Helm chart for version 3.0 of the Kubernetes Monitoring Helm chart.
We’re excited to share that the new Kubernetes Monitoring Helm chart is now available, and it introduces a dynamic way of setting up your telemetry data collection with Alloy Operator. In this blog post we’ll take a look at why we made the change, and how it makes configuration and customizing for your needs better.
Why change?
Let’s talk about why we created Alloy Operator in the first place:
- The main
values.yamlfile of the Helm chart was humongous. In version 1.6, there were almost 3,000 lines of code. It was daunting to try to find the few lines of code you care about. Even in Version 2.0, 71% of the values file was Grafana Alloy fields. - Each Alloy instance required a Helm subchart. Helm limits how subcharts are handled, meaning any modification you want to pass to the subchart’s values must be defined in the parent’s
values.yamlfile. And thevalues.yamlfile does not “template” itself. Not only does it become a lot of code, but it’s code that some users will never need or use, depending on their configuration. - We had a new feature to introduce, which meant yet another Helm chart. On top of all that, new Alloy instances are looming in the future.
Dynamic ‘feature influence’
The Alloy Operator can also dynamically configure the traditional Alloy objects using the instructions from the Kubernetes Monitoring Helm chart. When you select a feature you want to include, Alloy Operator configures the appropriate Alloy collector and its requirements. Requirements can be specific permissions, ports, environmental variables, and so on.
For example, if you enable the
Grafana Cloud Application Observability feature, the alloy-receiver instance will automatically have its ports opened to the matching receiver.
# Set by you:
applicationObservability:
 enabled: true
 receivers:
  zipkin:
   enabled: true
   port: 9411

# Automatically set by the Alloy Operator:
alloy-receiver:
 alloy:
  extraPorts:
   - name: zipkin
     port: 9411
     targetPort: 9411
     protocol: TCP
We have plans for even more places where enabling and configuring features will automatically configure your Alloy instances.
Tail sampling now available
We’re proud to announce that in version 3.0,
tail sampling is now as easy as enabling it within your otlp-type destinations. Prior to 3.0, this required configuring complex interactions between the Kubernetes Monitoring Helm chart and at least one or more additional Alloy instances. Tail sampling allows for traces to be “sampled” using various policies. Common options include filtering based on a percentage, status codes, or span attributes. Tail sampling is enabled under destinations:
destinations:
 - name: tempo
   type: otlp
   url: tempo.tempo.svc:4317
   traces: {enabled: true}
   processors:
     tailSampling:
       enabled: true
This will automatically deploy the extra Alloy instances required to properly apply your tail sampling policies, before delivering to your original intended destination. This dynamic deployment of Alloy was not possible without the Alloy Operator.
How Alloy Operator works
Alloy Operator is a Helm-based, small-footprint operator created using the
Operator SDK. Instead of requiring an Alloy instance and a Helm chart, Alloy Operator acts on kind: Alloy objects. When an Alloy object is deployed to the cluster by the Kubernetes Monitoring Helm chart, the Alloy Operator:
- Creates the components needed by the object (such as file system access, permissions, or the capability to read secrets)
- Performs a Helm install of the Alloy object and its components
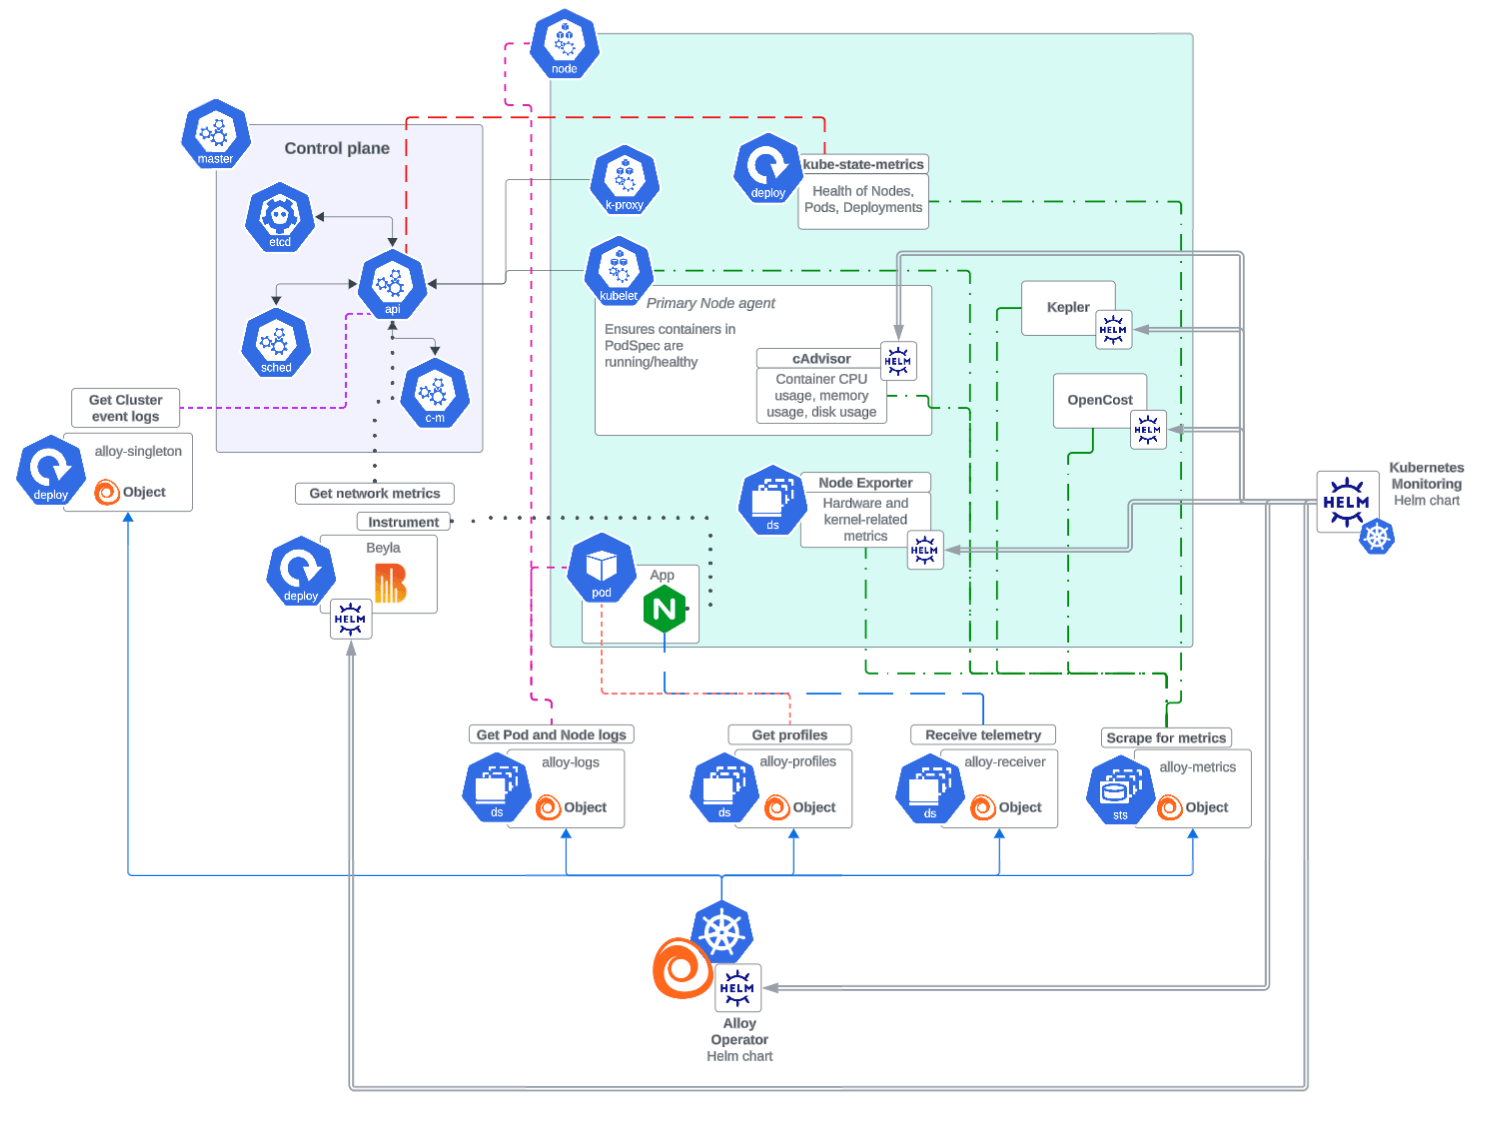
To view what’s been installed, you can use the Helm list command. This diagram shows all available Alloy objects installed as of 3.0.
Helm chart 3.0: same best practices as before
Helm chart 3.0 follows the same best practices as previous versions, and ensures encapsulation to maintain modularity and security. That means each object, whether Alloy, Node Exporter, or cAdvisor, is restricted to the permissions required for it to perform its function.
Upgrading from Helm chart v1
Even with all these changes, we’re doing what we can to make migration as simple as possible. Most of v1’s settings will map directly to a setting in v2. Plus, you can reference the
migration guide to help show how to do that. We are also building a
migration utility that should be able to take your v1 values.yaml file and return a valid v3 values.yaml file.
Upgrading from Helm chart v2.x
Alloy Operator requires the use of the new Alloy CRD, which will only be applied on new installations. With upgrades, you must first deploy the CRD. The Kubernetes Monitoring Helm chart will detect if the CRD is required and will print the location of the CRD for install. Alternatively, you can download the CRD manifest from the
Alloy Operator releases, and apply it with kubectl.
Feedback
We love to hear from you! All of the changes to the Kubernetes Monitoring Helm chart and the creation of Alloy Operator were inspired by the feedback and comments we have heard from our amazing community. If you are using the Helm chart, tell us what you think. We drive development on feedback and contributions. Find us in the Grafana public Slack in the #kubernetes channel, or attend one of our k8s-monitoring Helm chart office hours.
Grafana Cloud is the easiest way to get started with metrics, logs, traces, dashboards, and more. We have a generous forever-free tier and plans for every use case. Sign up for free now!


