

Adaptive alerting: faster, better insights with the new metrics forecasting UI in Grafana Cloud
In Grafana Cloud, we offer a range of AI capabilities to support your observability needs, including a feature for forecasting on any of your metrics and coupling it with Grafana Alerting. This is critical functionality if you want to make the switch from reactive to proactive alerting, as troubleshooting a problem before it arises is an important part of modern observability.
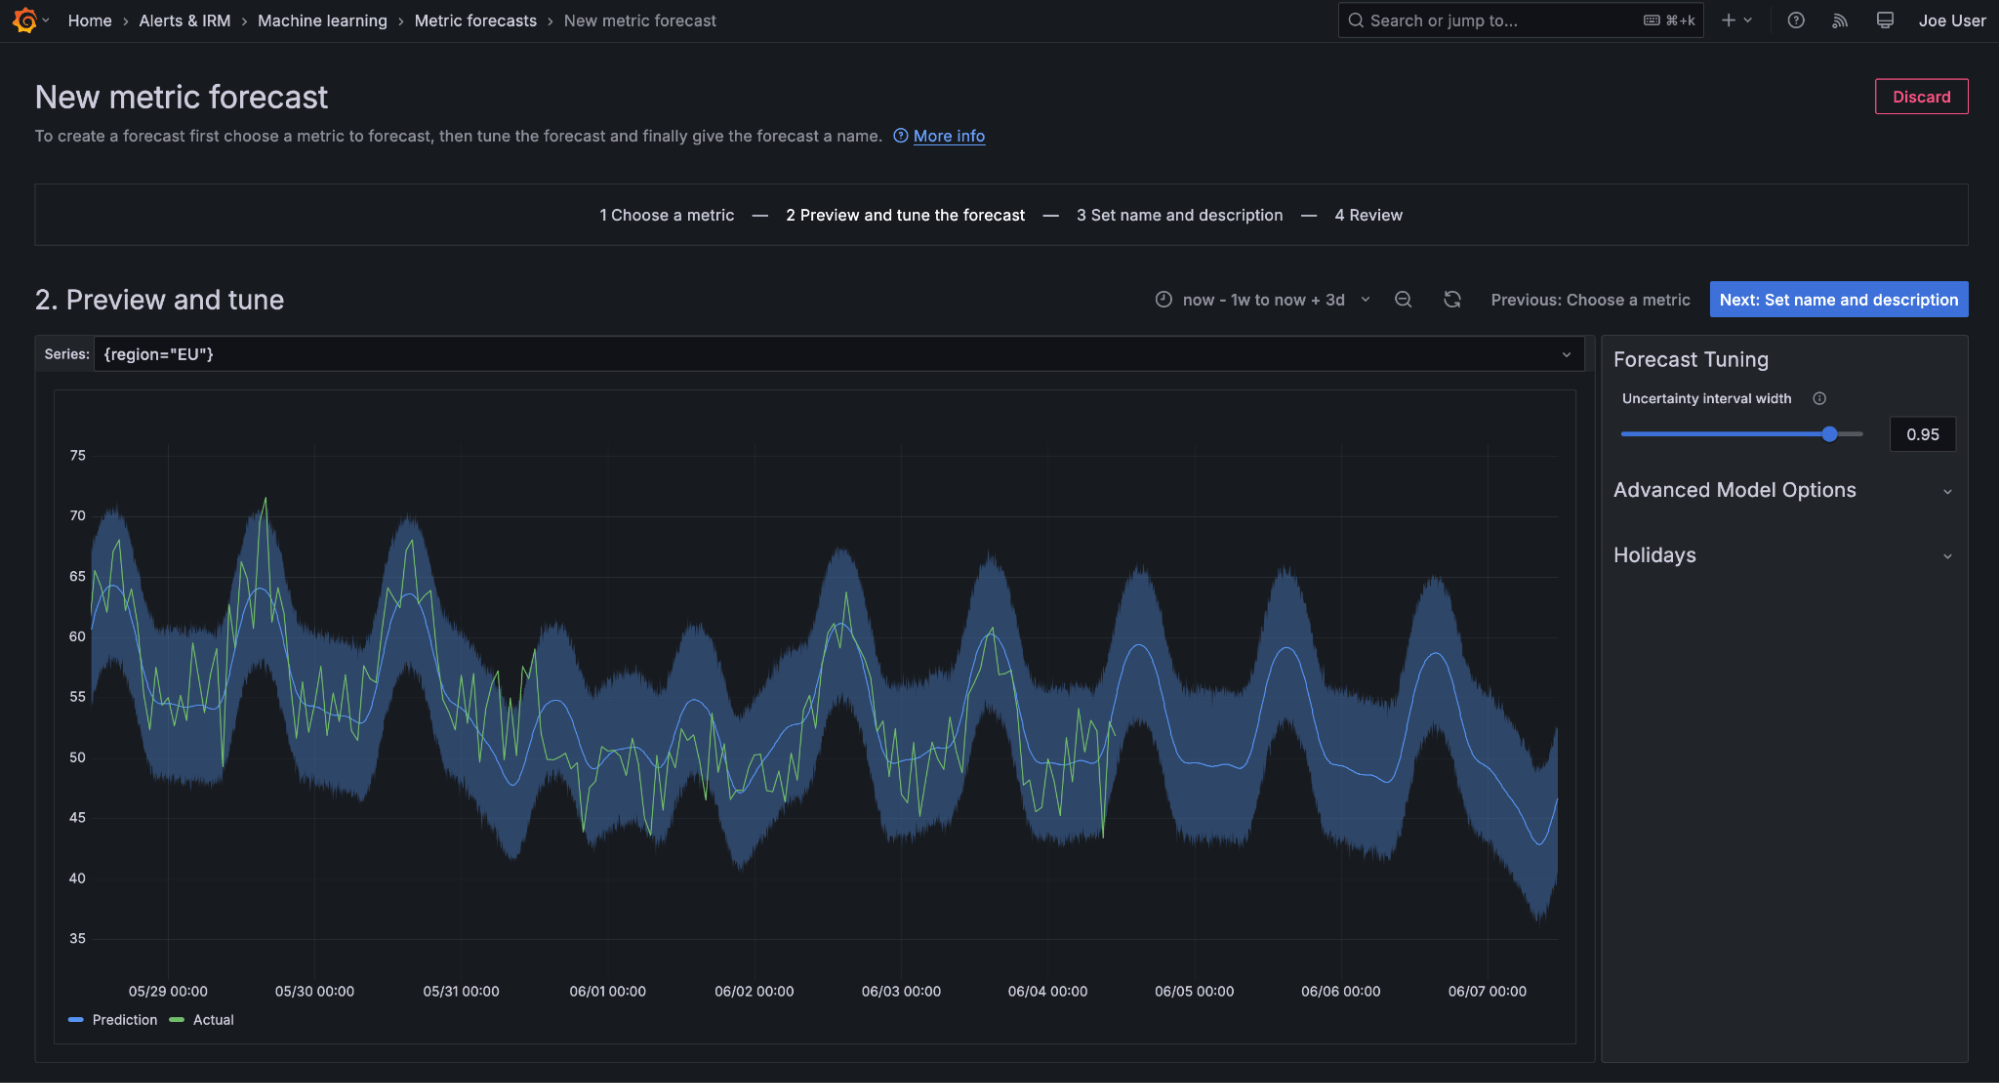
For our forecasting capabilities, we’re excited to announce a new and improved user interface designed to make exploring and fine-tuning forecasts faster, easier, and more intuitive than ever.You don’t have to go through several pages, settings, and optimizations anymore; we’ve streamlined the entire process.
With the new UI, testing your data for forecastability is easier than ever. You’ll see a live preview of the forecast right in your browser, letting you instantly assess how well the model fits your time series. If you think you can improve the model fit, you can now tweak model parameters in real time and see the impact instantly. No more guesswork—just immediate visual feedback.
Forecasting and adaptive alerting
Forecasting supports an observability method called adaptive alerting: Before a problem arises, an alert is triggered to catch the problem so it doesn’t manifest.
For example, let’s say you run a local e-commerce company that tracks its transactions and you want to have a better sense for your future needs. Of course, your transactions vary naturally. You might have more orders on the weekend than on weekdays. Or maybe you have more transactions during evenings than during working hours. By setting up a forecast on the transactions metric, you’ll fit this transaction behavior.
And when you combine this with alerts, you’ll know when a metric goes out of bounds instead of tuning static alerts, helping to ensure you’re on top of your transactions before you run into a situation where you can’t handle them due to a sudden surge. This is especially powerful when used in conjunction with our daily and weekly seasonality modes and inclusion of holidays.
How we improved metrics forecasting in Grafana Cloud
In order to support this new behavior, we have made some significant technical improvements by separating how we actually run forecasts in Grafana Cloud. (If you don’t have one already, you can sign up for a forever-free account today!)
Previously, we sent data and parameters into the backend, ran a model, and sent it back to the frontend so that it can be reviewed by the users. By putting the forecasting creation and tuning step into the frontend, it’s now possible to complete this step faster than ever. This is supported by the augurs library. Augurs does the heavy lifting in the frontend in the customization stage. After that’s done, the forecast is sent into the backend to be available 24/7.
How to setup an adaptive alert using forecasting
Learn how you can setup a forecast in this video:
There’s supposed to be a video here, but for some reason there isn’t. Either we entered the id wrong (oops!), or Vimeo is down. If it’s the latter, we’d expect they’ll be back up and running soon. In the meantime, check out our blog!
You can also follow this step-by-step tutorial:
- In Grafana Cloud, navigate to Metrics Forecast.
- Choose a metric to create a forecast from. We support the following data sources for forecasting: Prometheus, Graphite, Grafana Loki (metric queries only), Postgres, InfluxDB, Snowflake, Splunk, Elasticsearch, BigQuery, MongoDB, and Datadog.
- Use our instantaneous preview to tune your model. Also use our advanced model options if you think that the shown forecast isn’t good enough.
- When you’re done with tuning, give your forecast a name and check the box below it to also create an alert based on it. For names, we recommend that you follow your internal naming conventions to make sure that you find your forecasts more easily.
- Now you can click on Create forecast. Your forecast is now trained in the backend and available 24/7 to give you an adaptive alert.
FAQs on adaptive alerting
Now, maybe you read this entire blog, but you’re still unsure what we actually mean by adaptive alerting. Let’s take a look at this concept and its advantages in detail.
When should I use adaptive alerting?
Adaptive alerts are best suited to identify unexpected changes in human-derived usage patterns. These patterns will have daily ups and downs—people behave differently at work versus then at home or at rest. There are also weekly patterns—people behave differently on weekends as opposed to weekdays.
These patterns are evident in data such as the rate of sales transactions, or amount of traffic to a website (and system load that induces), but also in telemetry data of machinery in a factory or phone calls to a support hotline.
Adaptive alerts can identify partial failures in a way static alerts are unable to. For example, adaptive alerts can identify a sudden 20% drop in sales transactions due to a struggling payment vendor, a peculiar increase in traffic to a seldom-used API, or an unusual temperature rise in a machine during normal operation. These issues may not be immediately catastrophic, but the adaptive alert firing allows you to learn of the issue sooner and maybe even avoid a potential major problem.
What are the advantages of adaptive alerting?
Adaptive alerts are great at tracking unexpected changes in human-derived usage patterns, as mentioned above, but they also continuously learn and adapt to changes in that behavior.
Consider the example of a web service with a growing user base and how to detect a possible denial-of-service attack. A static threshold alert can accomplish this in the short term, but as the user base grows, so does the traffic. Having to continually increase the static threshold is bothersome and error-prone. An adaptive alert will recognize the growing traffic pattern and only alert on a dramatic rise in requests.
Adaptive alerts can also give special treatment to calendar days using the holidays feature, so expected drops or increases in your data on national holidays or other specified periods are accounted for and do not alert you unnecessarily.
What does adaptive alerting cost?
Metrics forecasting is now available in Grafana Cloud free of charge! If you are an Advanced or Enterprise customer, you can just start using it at no upcharge.
There are some usage limits, but talk to us about requesting limit increases.
Grafana Cloud is the easiest way to get started with metrics, logs, traces, dashboards, and more. We have a generous forever-free tier and plans for every use case. Sign up for free now!


