

Observability trends in Japan: Insights from Grafana Labs' latest survey
Japanese organizations are focused on controlling costs and limiting complexity—and they might be getting ready to broaden their adoption at just the right time, according to analysis of a micro survey on observability recently conducted by Grafana Labs.
Observability is an evolving space in Japan, and this is the first time Grafana Labs has run a Japanese version of our annual Observability Survey. It’s part of our efforts to better understand how organizations there are adopting observability and to share that information with the growing Grafana community in the country, and in doing so we uncovered some interesting insights about the state of observability in Japan.
In this blog post, we’ll share the highlights from the survey results, including how organizations are selecting their tools, the importance of open source and AI, and the continuing maturity of the market. And if you’re in Japan and you’re interested in how your organization compares to the rest of Asia and the world, check out our interactive Grafana dashboard where you can see visualizations of many of the stats that we’ll discuss here and more.
Cost and ease of use are driving tool selection
Cost is paramount, with 82% of respondents citing it as one of their most important criteria when selecting a new observability tool. That puts Japan ahead of its peers in emphasizing budget constraints, as 72% of Asian respondents and 74% of all respondents cited it as a top criteria in our global survey.
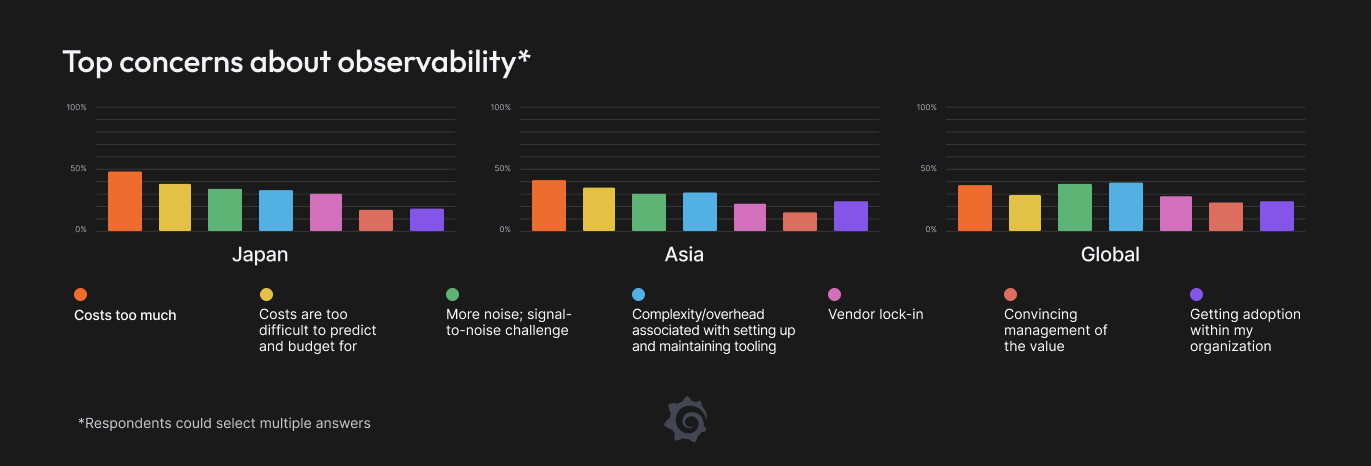
It should come as no surprise then that cost was also the biggest concern about observability (48%), followed by costs being too difficult to predict and budget for (38%). Japanese respondents were also more likely to cite both of these concerns than their Asian or global counterparts.
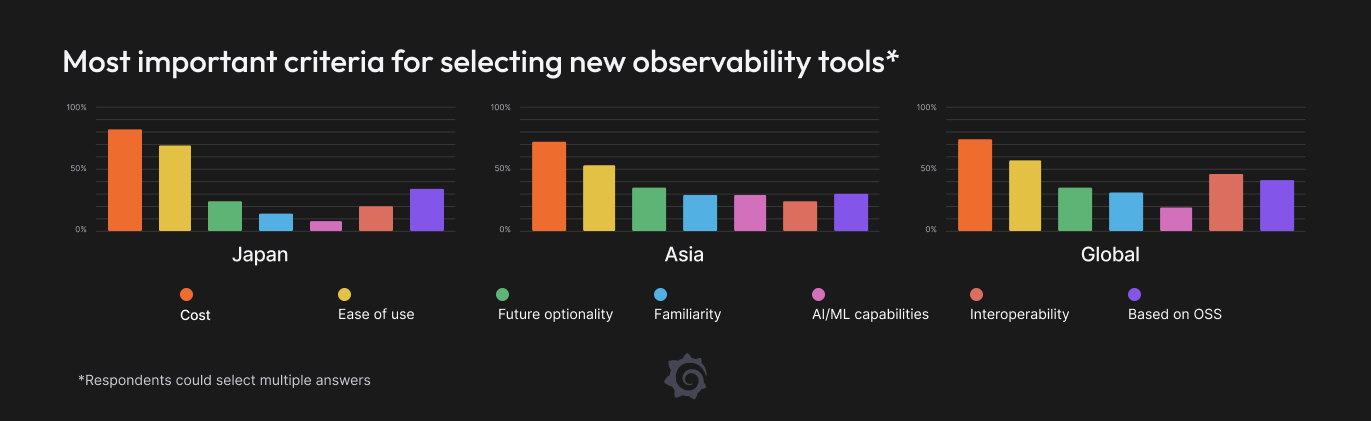
At the same time, organizations are prioritizing ease of use, with 69% citing it as a top selection criteria, compared to just 53% of Asian respondents and 57% of all respondents in our global survey. They’re also more likely to be concerned about signal-to-noise ratio (34%) and complexity/overhead associated with setting up and managing tooling (33%) than the rest of Asia (30% and 31%, respectively).
Note: Global concerns about noise and complexity are higher (38% and 39%, respectively), which may point to deeper technical debt. See the final section for more on this.
Ease of use also plays a role in observability setups. Organizations turn to SaaS when they want the benefits of observability without the overhead of managing the underlying infrastructure, and half (50%) of all Japanese respondents are using SaaS in some capacity (“SaaS only,” mostly SaaS," “roughly equal” split with self-managed). That’s more than the global usage (42%), though it lags behind the rest of Asia (57%).
OpenTelemetry is generating a lot of attention
In general, open source is a big part of Japanese observability adoption, though it’s not as high as other parts of the world. Two-thirds of all respondents (66%) are using open source licensing for observability (“open source only,” “mostly open source,” “roughly equal” with commercial licensing), which is less than the rest of Asia (71%) and the world (76%). And when it comes to prioritizing open source technologies when selecting new tools, they’re less likely to cite it as important (34%) than their global counterparts (41%) but more likely than the rest of Asia (30%).
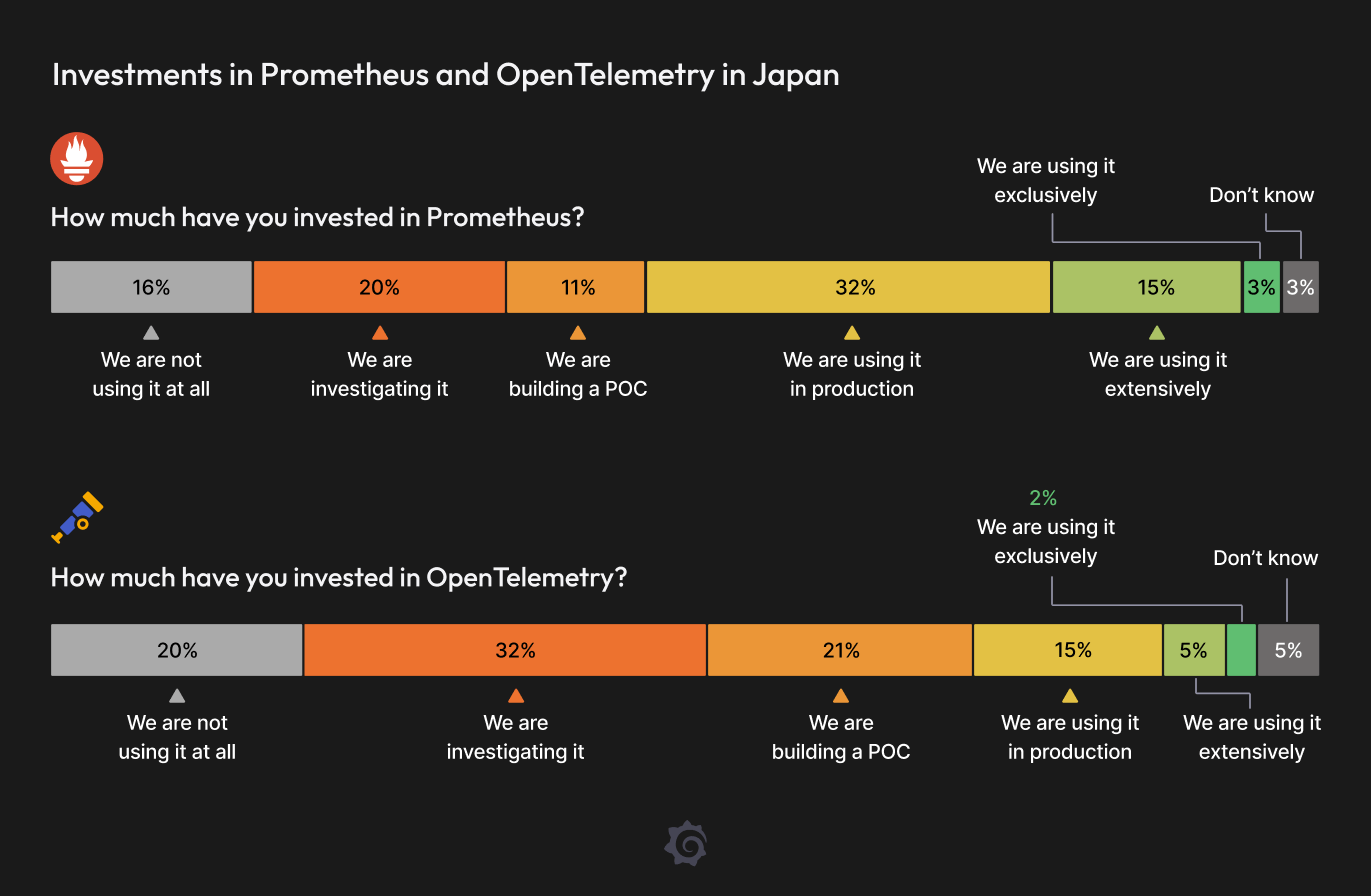
Japanese organizations are also keen to adopt OpenTelemetry, which is quickly emerging as a de facto standard for telemetry collection, processing, and delivery. In fact, 75% of all respondents say they’re using it in some capacity (“investigating,” “building a POC,” “using in production,” “using extensively,” “using exclusively”). That’s less than the Asian and global figures (81% and 79%, respectively). However, Japanese organizations are much more likely to be investigating OpenTelemetry (32%) than their Asian and global counterparts (19% and 18%, respectively), which could indicate a greater capacity for growth in the years ahead.
Prometheus, another industry standard that rose to prominence with Kubernetes monitoring, is also popular there: 80% are using it in some capacity. Prometheus is used in production (“in production,” “extensively,” “exclusively”) by 50% of Japanese respondents, compared to the 22% using OpenTelemetry in production. However, Japanese respondents use Prometheus less overall than their Asian and global counterparts.
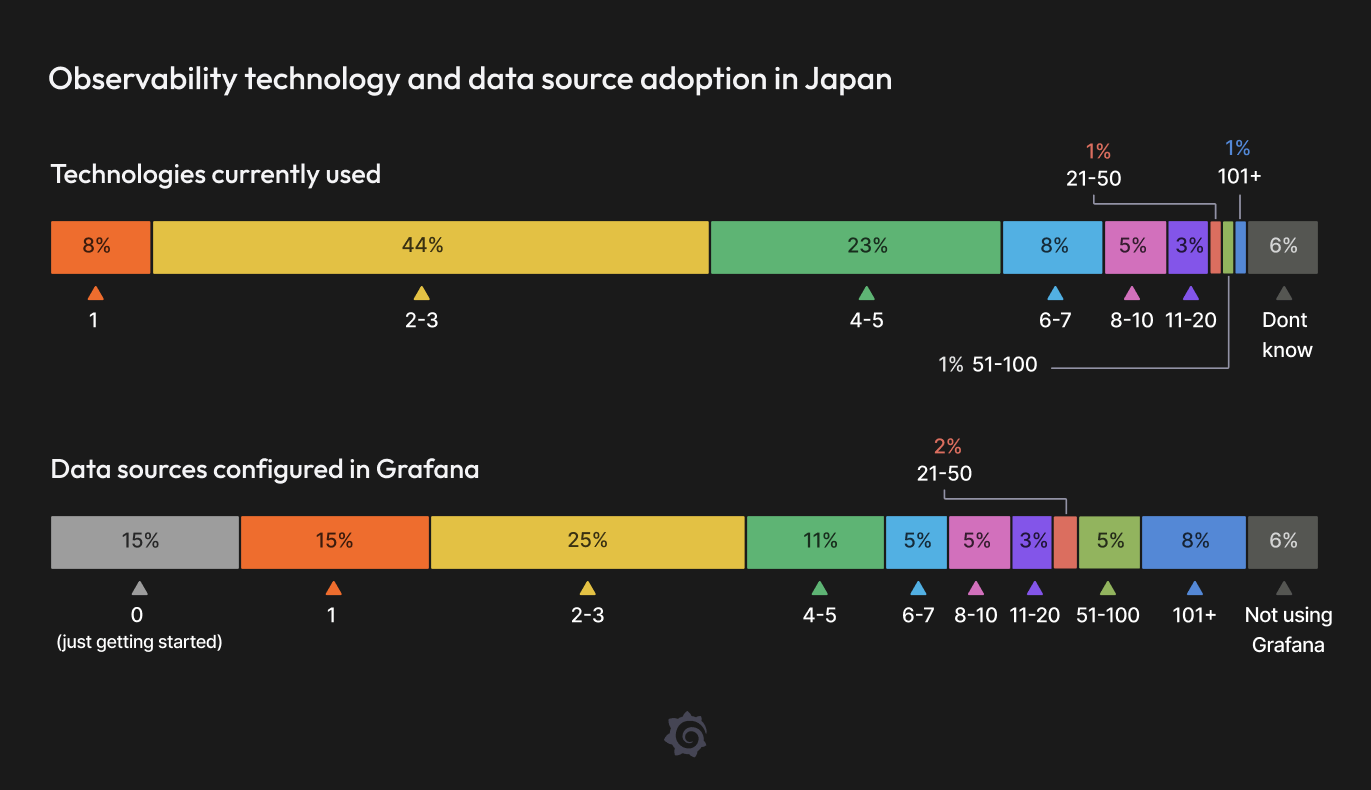
It’s still early days for observability adoption in Japan—and that might be a good thing
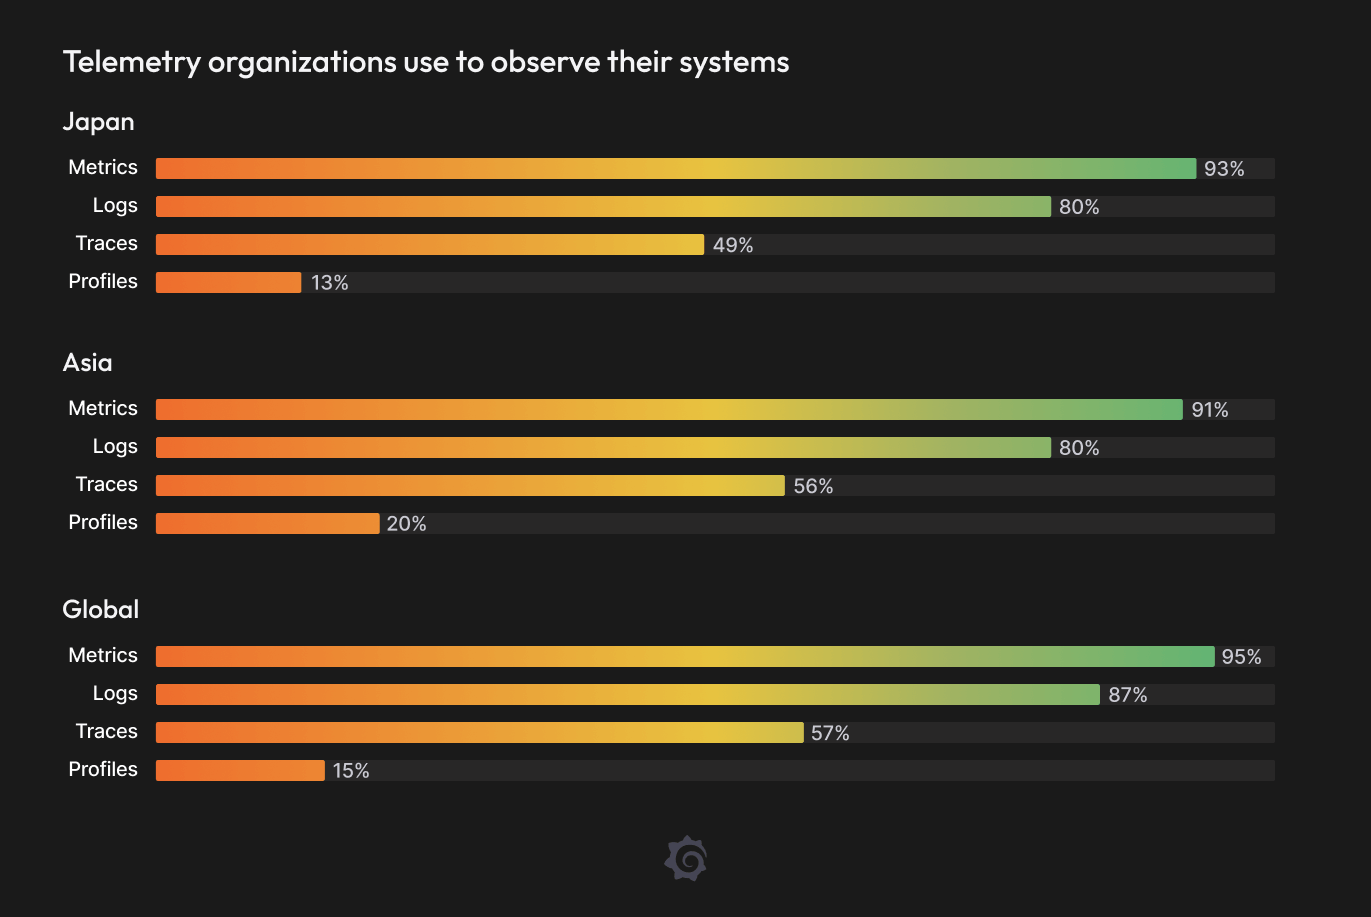
Japanese survey respondents have fewer observability technologies than their peers. The majority of Japanese organizations (52%) use three or fewer observability technologies, which is much higher than Asian (41%) and world (32%).
They’re also less likely to use traces and profiles, which are generally used in more advanced observability operations.
In addition, they’re much less likely to use what we consider the most mature and scalable approach to observability: a centralized team runs the observability platform and provides best practices and support, but doesn’t directly manage observability for individual services. Only 28% of Japanese respondents said that was the case at their organization, compared to 39% in all of Asia and 38% globally.
However, there may be a silver lining in taking a more patient approach to adopting observability, as it becomes more of a mainstream and battle-tested approach around the rest of the world. For example, they’re less concerned about convincing management of the value of observability (17%) and getting adoption with their organization (18%)
In addition, fewer tools and data sources means less technical debt, and that was reflected in respondents’ tool-selection priorities as well. They were less likely to prioritize interoperability with other tools used at their organization (20%), compared to the rest of Asia and the world (24% and 46%, respectively). And less experience with observability means fewer concerns about existing in-house expertise, with only 14% citing familiarity/adoption within their organization than the rest of Asia and the world (29% and 31%, respectively).
AI wishlist
It’s hard to talk about the maturing observability space—or technology in general these days—without discussing AI. We asked respondents which areas of observability they would benefit the most from if they had an AI/ML wishlist, and the only one selected by more than half of all respondents was training-based alerts that fire when a metric changes from its usual pattern or is an outlier in a group (52%). The next closest was the ability to reduce unused/underutilized resources and telemetry (44%).
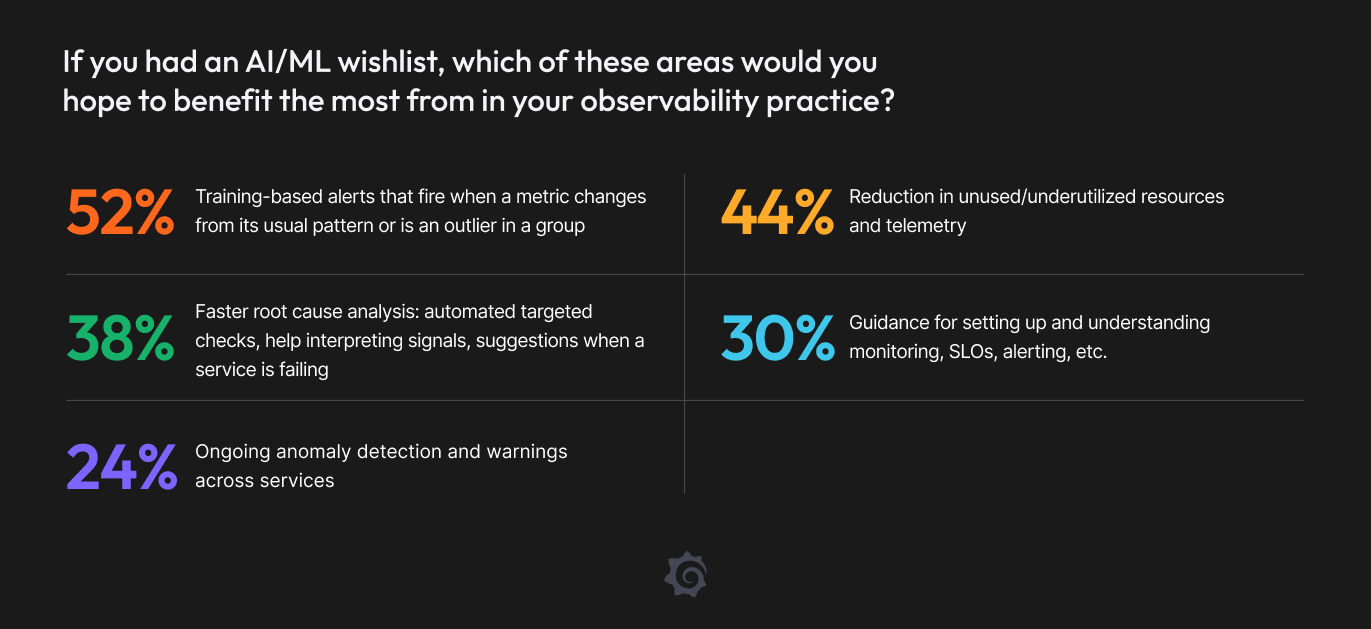
Note: Respondents to the Japanese survey could select as many responses as they wanted, while the global survey respondents could only select one. Because of the different question format, we can’t compare the two.
However, the Japanese market may be more wary about AI capabilities than other parts of the globe. Only 8% said it was an important criteria when selecting a new observability tool, compared to 28% in Asia and 19% globally.
About the survey
This survey was conducted at ObservabilityCON on the Road in Tokyo in February of this year. In total, 108 people participated across a range of demographics:
- Role: Respondents worked in more than a dozen different roles, from individual contributors up to executives. The most commonly cited roles were SREs (27%) and developers (28%).
- Industry: Participants came from 15 different industries, with software and technology (39%) representing the largest share.
- Size: Companies of all sizes were represented in the survey, with the most common ones being those with between 101-500 employees (27%) and those with more than 5,000 employees (24%).
Our third annual Observability Survey, which contained many of the same questions, as well as additional questions around incident response and emerging areas of observability, was conducted globally and featured responses from 1,255 industry practitioners, with 338 of those coming from Asia. To learn more, check out the main report, as well as the interactive dashboard and our in-depth analysis of the survey findings.


